Appendix Appendix D Additional Descriptive Figures
Figure D3 plots the quarterly shares of postings classified as E0, E1, and E2. Figure D4 and Figure D5 report the quarterly trends in the alternative exposure indices $\alpha$ and $\gamma$. Figure D6 further shows the quarterly change in $\beta$ by occupation group and job seniority.
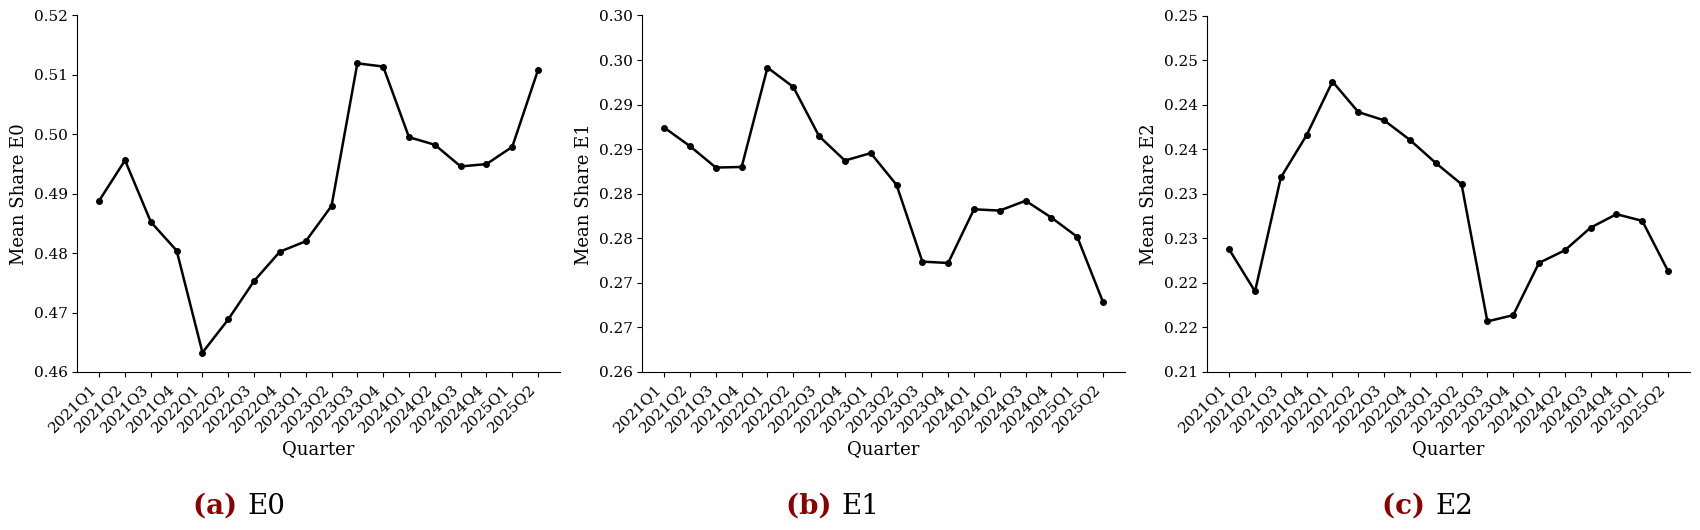
Notes: This figure plots the quarterly mean posting-level weighted shares of task content in E0, E1, and E2 from 2021Q1 to 2025Q2. E0 denotes no meaningful exposure to generative AI, E1 denotes direct exposure, and E2 denotes indirect exposure.
Figure D3: Quarterly Trends in E0, E1, and E2 Shares
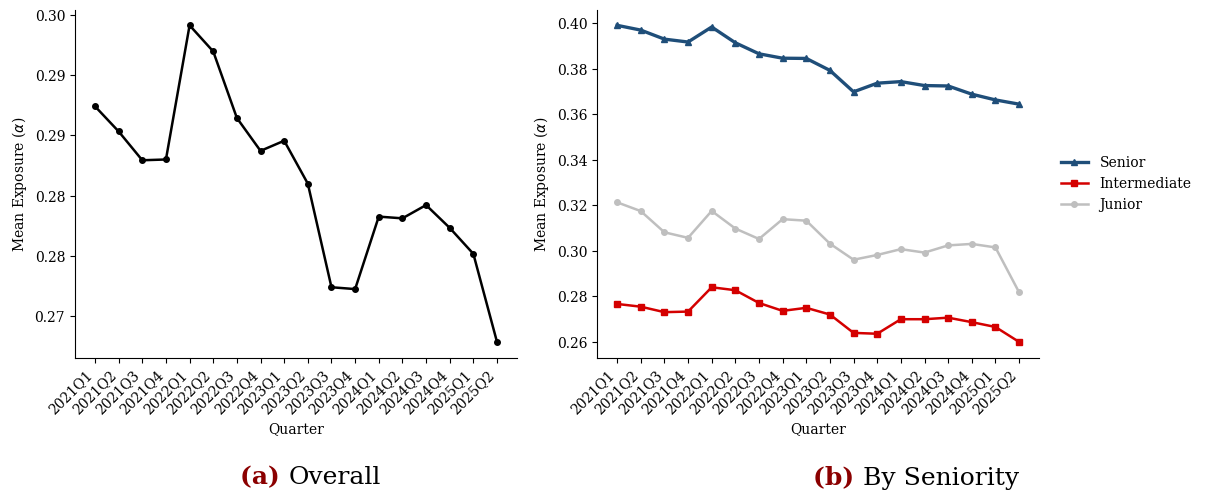
Notes: This figure plots the quarterly trend in the alternative posting-level exposure measure $\alpha$ from 2021Q1 to 2025Q2. As discussed in the main text, $\alpha$ captures only direct exposure.
Figure D4: Quarterly Trend in Exposure Measure $\alpha$
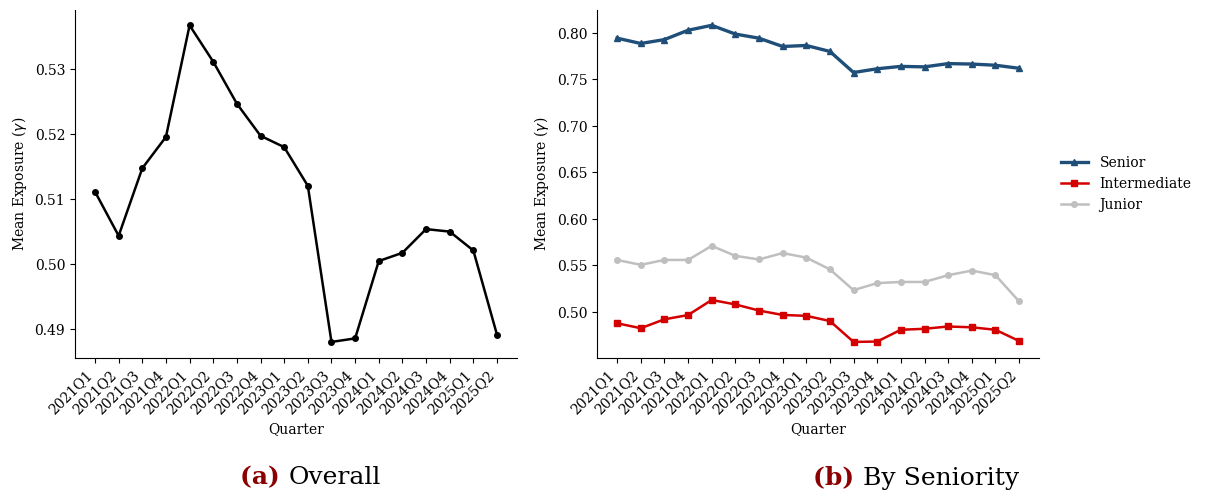
Notes: This figure plots the quarterly trend in the alternative posting-level exposure measure $\gamma$ from 2021Q1 to 2025Q2. As discussed in the main text, $\gamma$ assigns full weight to both direct and indirect exposure.
Figure D5: Quarterly Trend in Exposure Measure $\gamma$
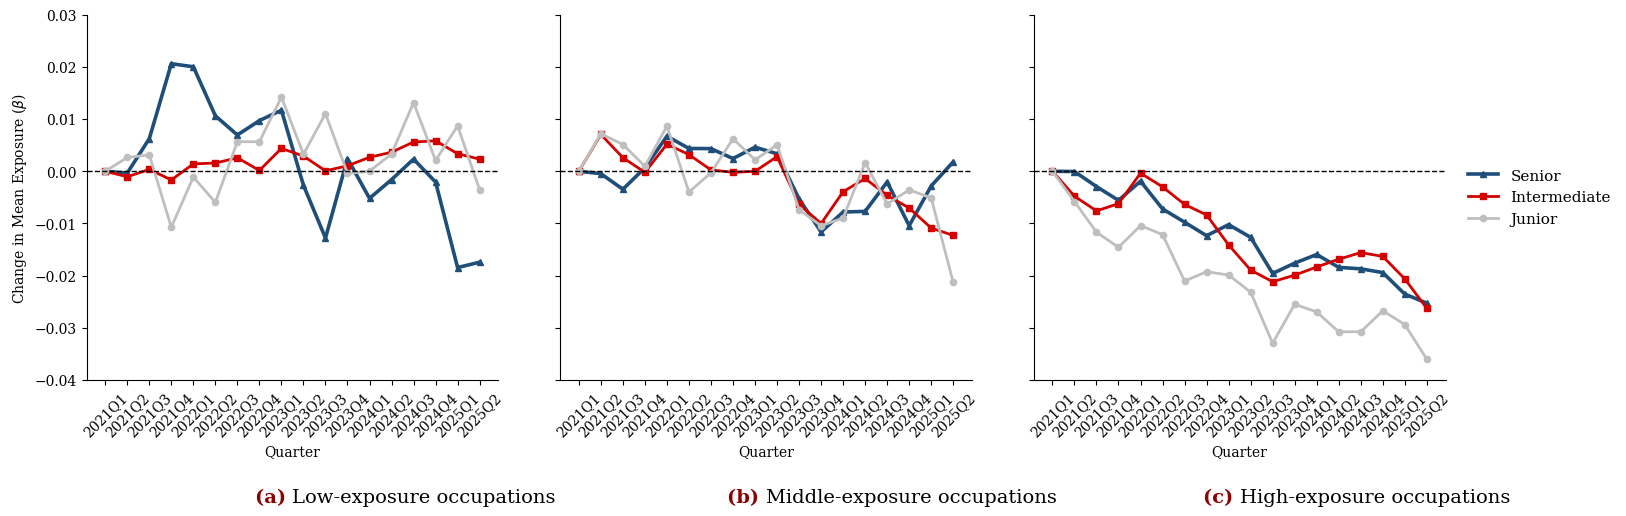
Notes: This figure groups occupations into three categories based on their average posting-level exposure, $\beta$, over the full sample period: low-, middle-, and high-exposure occupations. Within each occupation group, it plots the quarterly change in mean exposure separately for junior, intermediate, and senior postings. The vertical dashed line marks 2022Q4, and the horizontal dashed line indicates zero change.
Figure D6: Changes in Generative AI Exposure by Occupation Group and Job Seniority