3 Data
3.1 Lightcast Job Postings Data
Our main data source is the U.S. online job postings database maintained by Lightcast.[^4] Lightcast provides a large-scale, nationwide collection of vacancy advertisements posted by employers across industries, locations, and job types. It aggregates postings from more than 220,000 websites, including company career pages, national and local job boards, and job-posting aggregators. In the United States, Lightcast covers more than 435 million job postings since 2010. The data have been widely used in labor economics and related fields to study skill demand, technological change, and firm hiring behavior (Deming and Kahn, 2018; Acemoglu et al., 2022; Antoniades et al., 2025).
These data are well suited to our research questions for two reasons. First, they allow us to observe posted labor demand at national scale. This is important because generative AI may affect different parts of the economy in different ways. A sample limited to selected occupations, industries, or firms may miss how adjustment in one segment of the labor market offsets, reinforces, or differs from adjustment elsewhere. Second, job postings contain rich textual descriptions of the tasks, skills, and responsibilities that employers associate with each vacancy. This allows us to measure generative AI exposure at the level of individual postings and to study how exposure changes as employers revise job content over time.
This combination of scale and textual detail distinguishes job postings data from other data sources commonly used in this literature. Occupation-level task databases such as O*NET provide standardized descriptions of work activities, but they assign a common task profile to an occupation and are not designed to capture rapid changes in job content within occupations.[^5] Employment or payroll data, such as those used in recent studies of AI and labor-market outcomes (Brynjolfsson et al., 2025a), provide important evidence on realized employment but generally do not observe the task content of posted vacancies. Our setting requires both features: national coverage of labor demand and detailed information about what jobs contain. The Lightcast’s job postings data allow us to examine two margins of adjustment to generative AI: reallocation in hiring demand across jobs and redesign of task content within comparable jobs.
The job description text is the primary input to our measurement strategy. We use it to extract posting-specific tasks and to construct each posting’s exposure to generative AI. Unlike occupation-level exposure measures that assign the same score to all jobs within an occupation (Eloundou et al., 2024), posting text allows exposure to vary across jobs within the same occupation, across industries and seniority levels, and over time. This feature is central to our analysis because a main premise of the paper is that exposure is not fixed. It may evolve as firms change the tasks they request from their employees.
We complement the text with structured variables. Each posting is mapped to a standardized O*NET occupation code and a two-digit NAICS industry code, which allow us to compare jobs across occupations and sectors. We also use Lightcast’s job seniority variable to classify postings into broad career stages. Lightcast identifies postings as Junior or Senior when the job title or posting text contains clear seniority language; postings without such language are classified as Intermediate. In addition, we use Lightcast’s extracted skills data, including common and specialized skills, as inputs into our exposure-construction pipeline. These skill variables help organize posting text into skill groups, match extracted tasks to those groups, and weight tasks linked to specialized and common skills. Finally, we use other posting characteristics available in the data, including location, employment type, internship indicators, and remote-work indicators.
3.2 Sampling Strategy
Our sampling strategy is motivated by the scale of the raw data and the computational demands of our measurement approach. During our study period, from January 2021 through June 2025, the raw Lightcast data contain more than 188 million U.S. job postings. Because our exposure measure requires applying a two-stage large language model pipeline to job posting text, processing the full corpus is computationally infeasible. We therefore implement a repeated random sampling procedure designed to preserve the key sources of heterogeneity that are central to our research design: occupation, industry, seniority, and time.
We sample within cells defined by three dimensions. The first dimension is occupation, measured using the O*NET occupation code. Occupation is the natural starting point because much of the existing generative AI exposure literature measures exposure at the occupation or occupation-task level (Eloundou et al., 2024; Brynjolfsson et al., 2025a). It is also likely to capture broad differences in the task content of work and in the potential applicability of generative AI.
The second dimension is industry, measured using the two-digit NAICS code. Even within the same occupation, jobs may involve different tasks across industries. For example, a data analyst, marketing specialist, or software developer may perform different activities depending on whether the employer is in finance, health care, manufacturing, retail, or professional services. Incorporating industry into the sampling design helps preserve this cross-sector heterogeneity and allows us to distinguish economy-wide labor-demand adjustment from changes concentrated in particular sectors.
The third dimension is seniority, measured using Lightcast’s job seniority classification. Seniority is central to our analysis because recent research and public debate have raised the possibility that generative AI may affect junior and senior roles differently (Hampole et al., 2025; Brynjolfsson et al., 2025a). Existing studies often assign the same occupation-level exposure score to all workers or postings within an occupation, which makes it difficult to observe whether exposure differs across career stages within the same occupation. By incorporating seniority directly into our sampling design, we ensure that junior, intermediate, and senior postings are represented within occupation-by-industry groups.
Operationally, for each half-year period from January 2021 through June 2025, we group postings into occupation $\times$ seniority $\times$ industry cells. This procedure yields 25,349 cells in total. We drop cells with fewer than 20 postings in a given half-year period. These sparse cells account for approximately 0.45% of all postings, so the restriction removes only a negligible share of the raw data while reducing noise from very small cells. We then draw a 5% random sample from the remaining postings within each occupation $\times$ seniority $\times$ industry cell-period. This repeated cell-period sampling procedure yields a final sample of 9,373,092 postings.
The sampling design serves two purposes. First, it makes the LLM-based measurement task computationally feasible while retaining a large, nationwide sample of job postings. Second, it preserves the empirical variation needed for our decomposition analyses. Because the sample is drawn within occupation-by-industry-by-seniority cells over time, it maintains the structure required to study both changes in the composition of posted labor demand and changes in exposure within comparable jobs.
Figure 1 compares the quarterly number of postings in the full nationwide Lightcast data and in our sampled data. The two series track each other closely. Both rise through 2021 and early 2022, peak around the second quarter of 2022, decline throughout 2023, and begin to recover in early 2024. The close alignment indicates that our sampling procedure preserves the main aggregate dynamics of the underlying population.
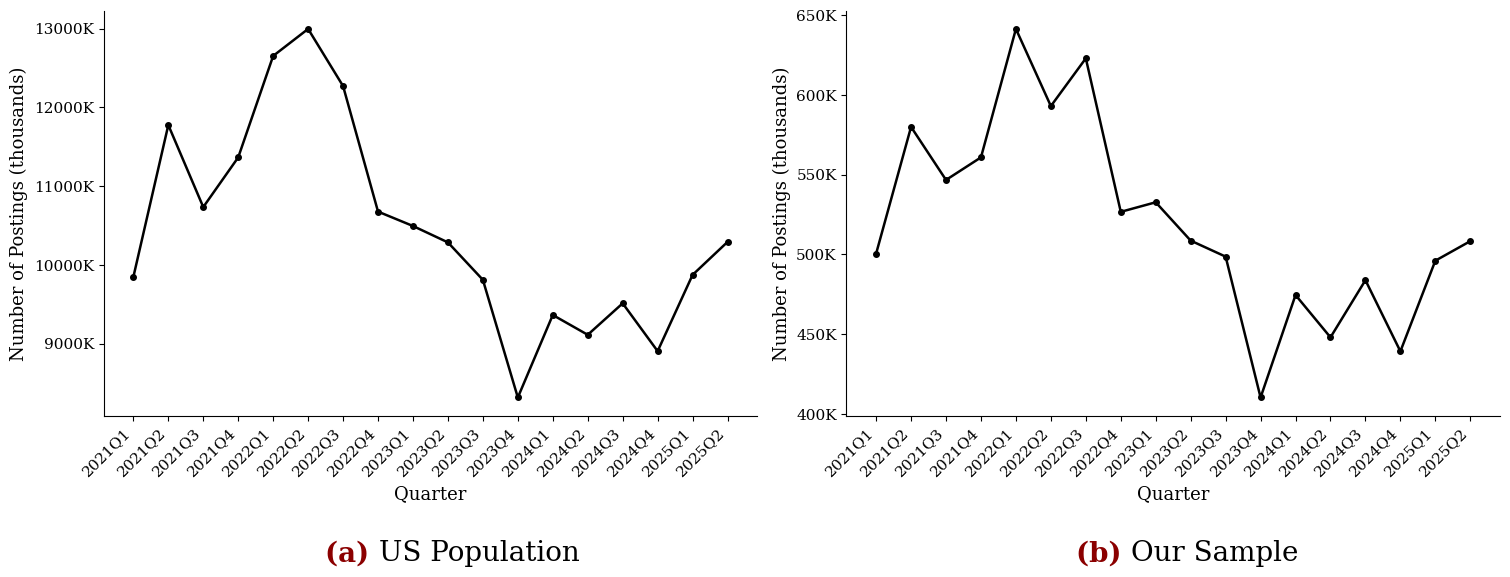
Notes: This figure compares the quarterly number of postings in the full data (Panel (a)) and in our sampled data (Panel (b)) from Quarter 1, 2021 to Quarter 2, 2025.
Figure 1: Quarterly Number of Job Postings in the U.S. Population and Our Sample