Appendix Appendix H Additional decomposition evidence
H.1 Exposure levels and counterfactual paths
Figure H9 plots observed aggregate generative AI exposure together with two counterfactual paths. The composition counterfactual allows posting shares to vary over time while holding within-cell exposure fixed at its 2021 level, whereas the within-only counterfactual allows within-cell exposure to vary over time while holding posting shares fixed at their 2021 values. This figure provides a level-based benchmark for the decomposition reported in the main text.
The figure confirms the same qualitative pattern as Figure 6. In the earlier part of the sample, the composition counterfactual tracks observed exposure closely, while the within-only counterfactual remains much closer to the 2021 baseline. This indicates that the early increase in aggregate generative AI exposure is driven mainly by compositional reallocation across job cells. After 2023Q3, however, both counterfactual paths move downward relative to the baseline, indicating that the later decline reflects both a reversal in hiring composition and a reduction in exposure within cells.
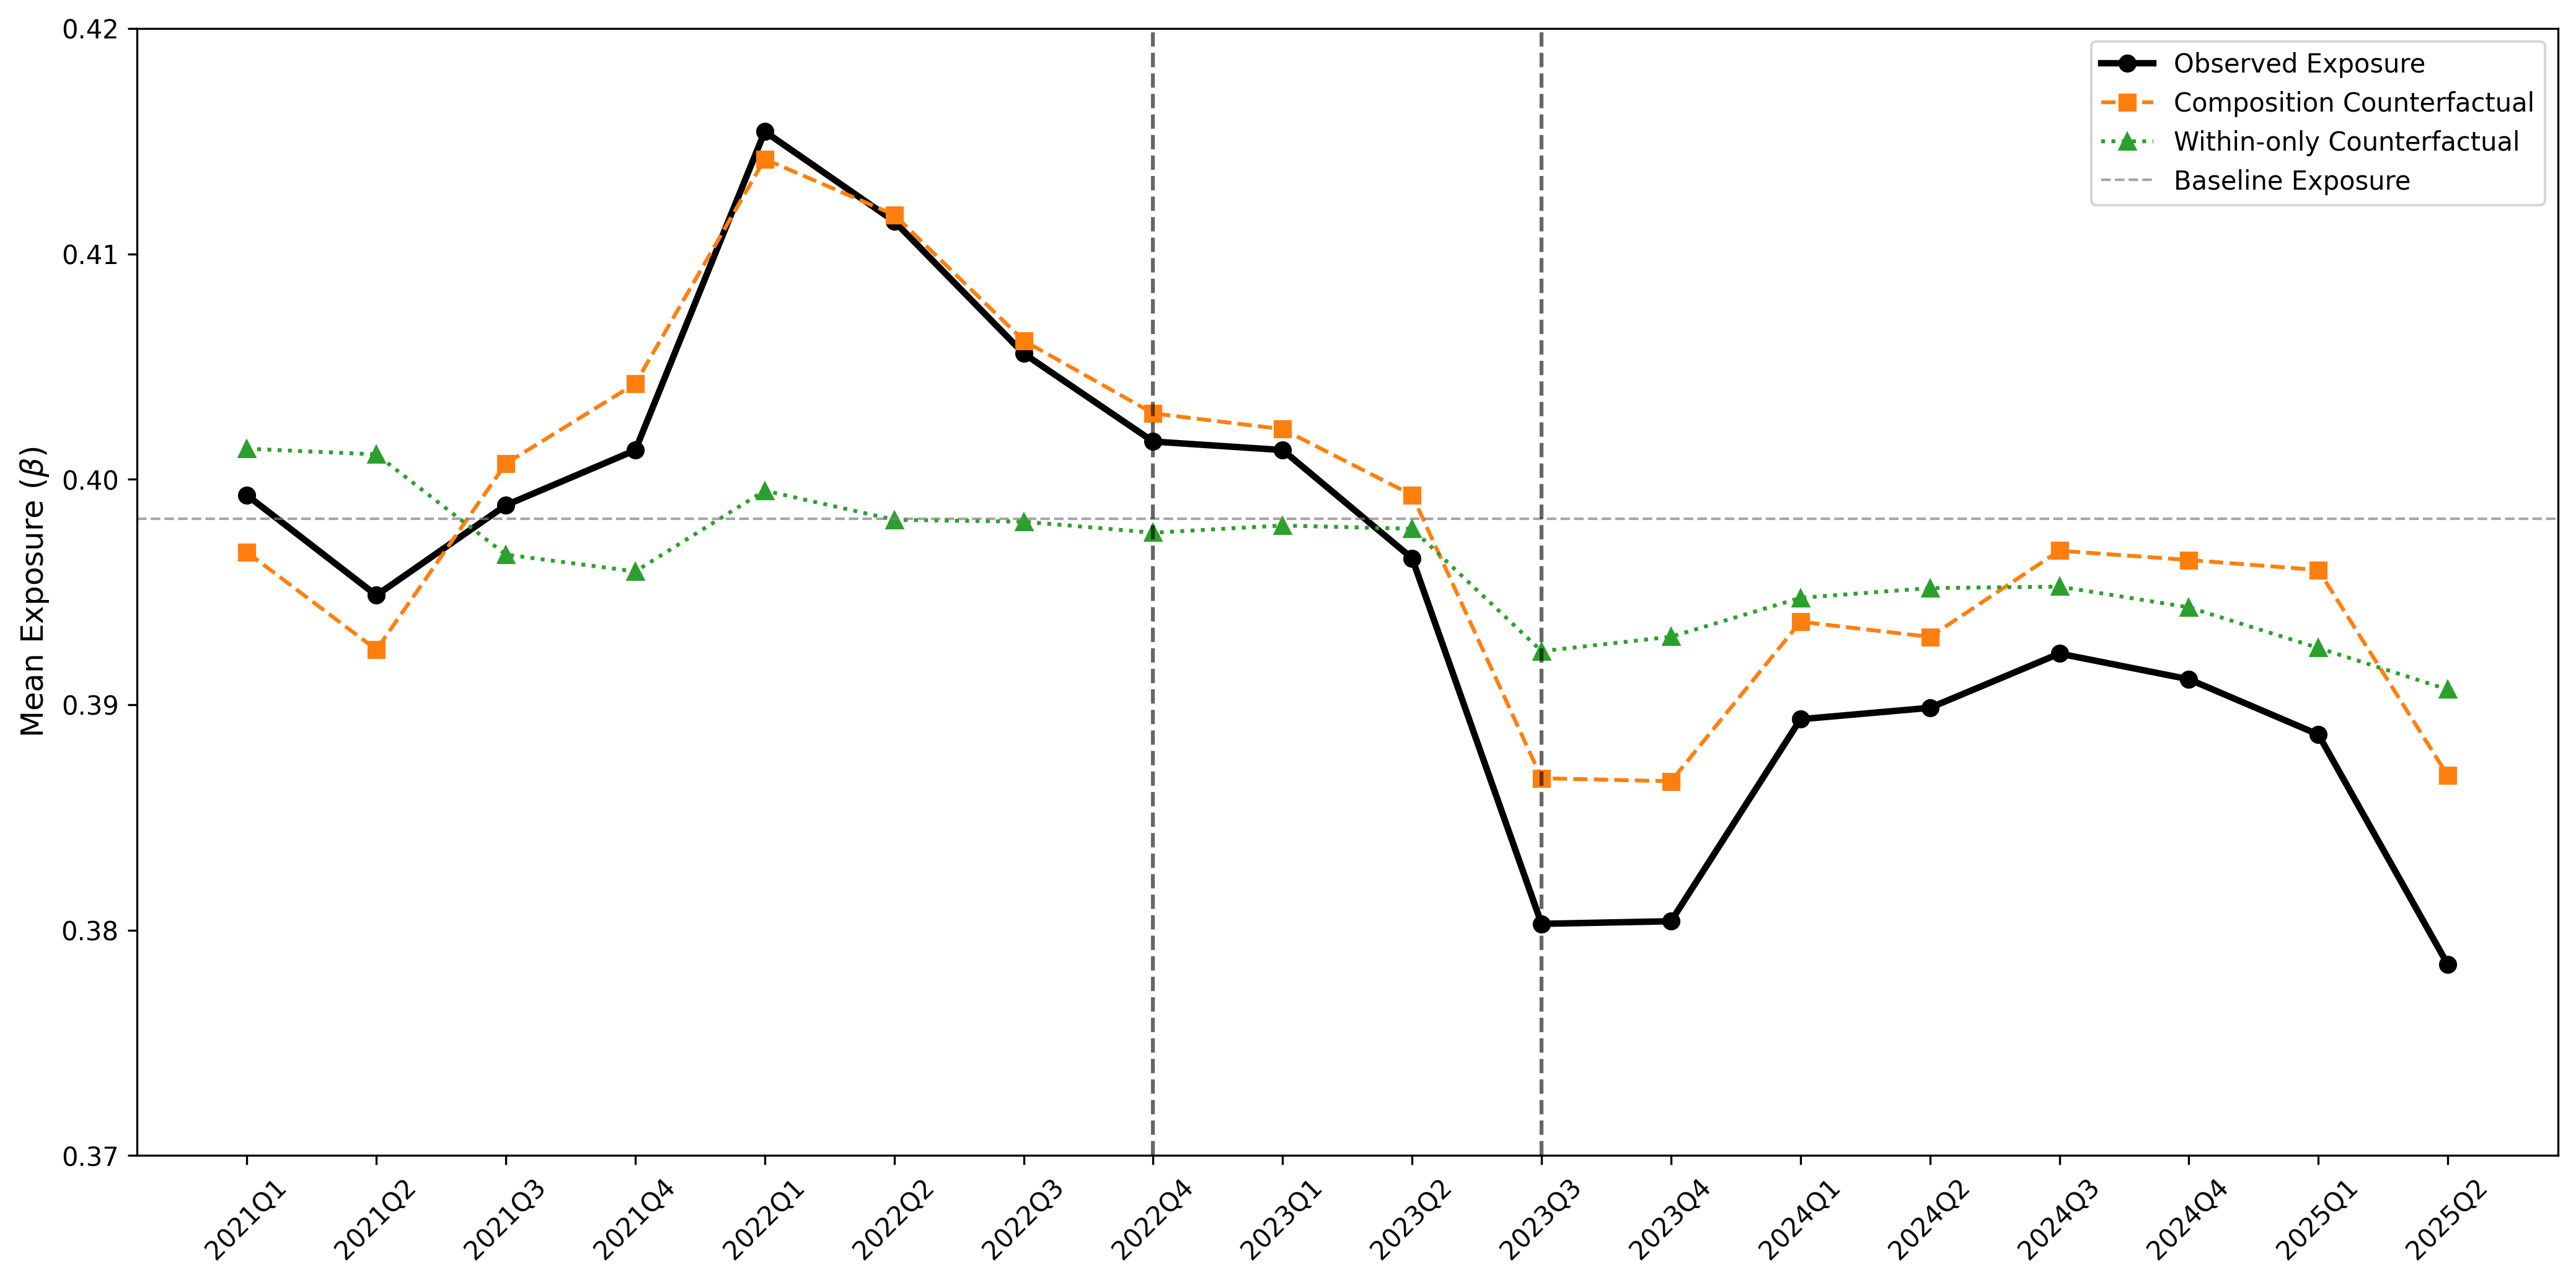
Notes: The figure plots observed aggregate exposure together with two counterfactual paths. The composition counterfactual allows posting shares to vary over time while holding within-cell exposure fixed at its 2021 level. The within-only counterfactual allows within-cell exposure to vary over time while holding posting shares fixed at their 2021 values. The horizontal dashed line denotes the 2021 baseline exposure.
Figure H9: Aggregate Generative AI Exposure over Time and Counterfactual Paths
H.2 Relative contribution of decomposition components
Figure H10 reports the relative contribution of each component in absolute terms. For each quarter, the contribution of a component is defined as its absolute value divided by the sum of the absolute values of the composition effect, the within-cell exposure effect, and the interaction effect. This figure complements the main decomposition by showing the relative importance of each margin independent of sign.
The figure reinforces the pattern discussed in the main text. In the earlier part of the sample, the composition effect accounts for the largest share of aggregate generative AI exposure change, consistent with the interpretation that the initial increase in exposure is driven mainly by reallocation in hiring shares across job cells. In the later part of the sample, the relative contribution of the within-cell exposure effect becomes larger, indicating that changes within job cells play an increasingly important role in lowering aggregate exposure. The interaction term remains smaller than the other two components in most quarters, although its contribution rises around some turning points.
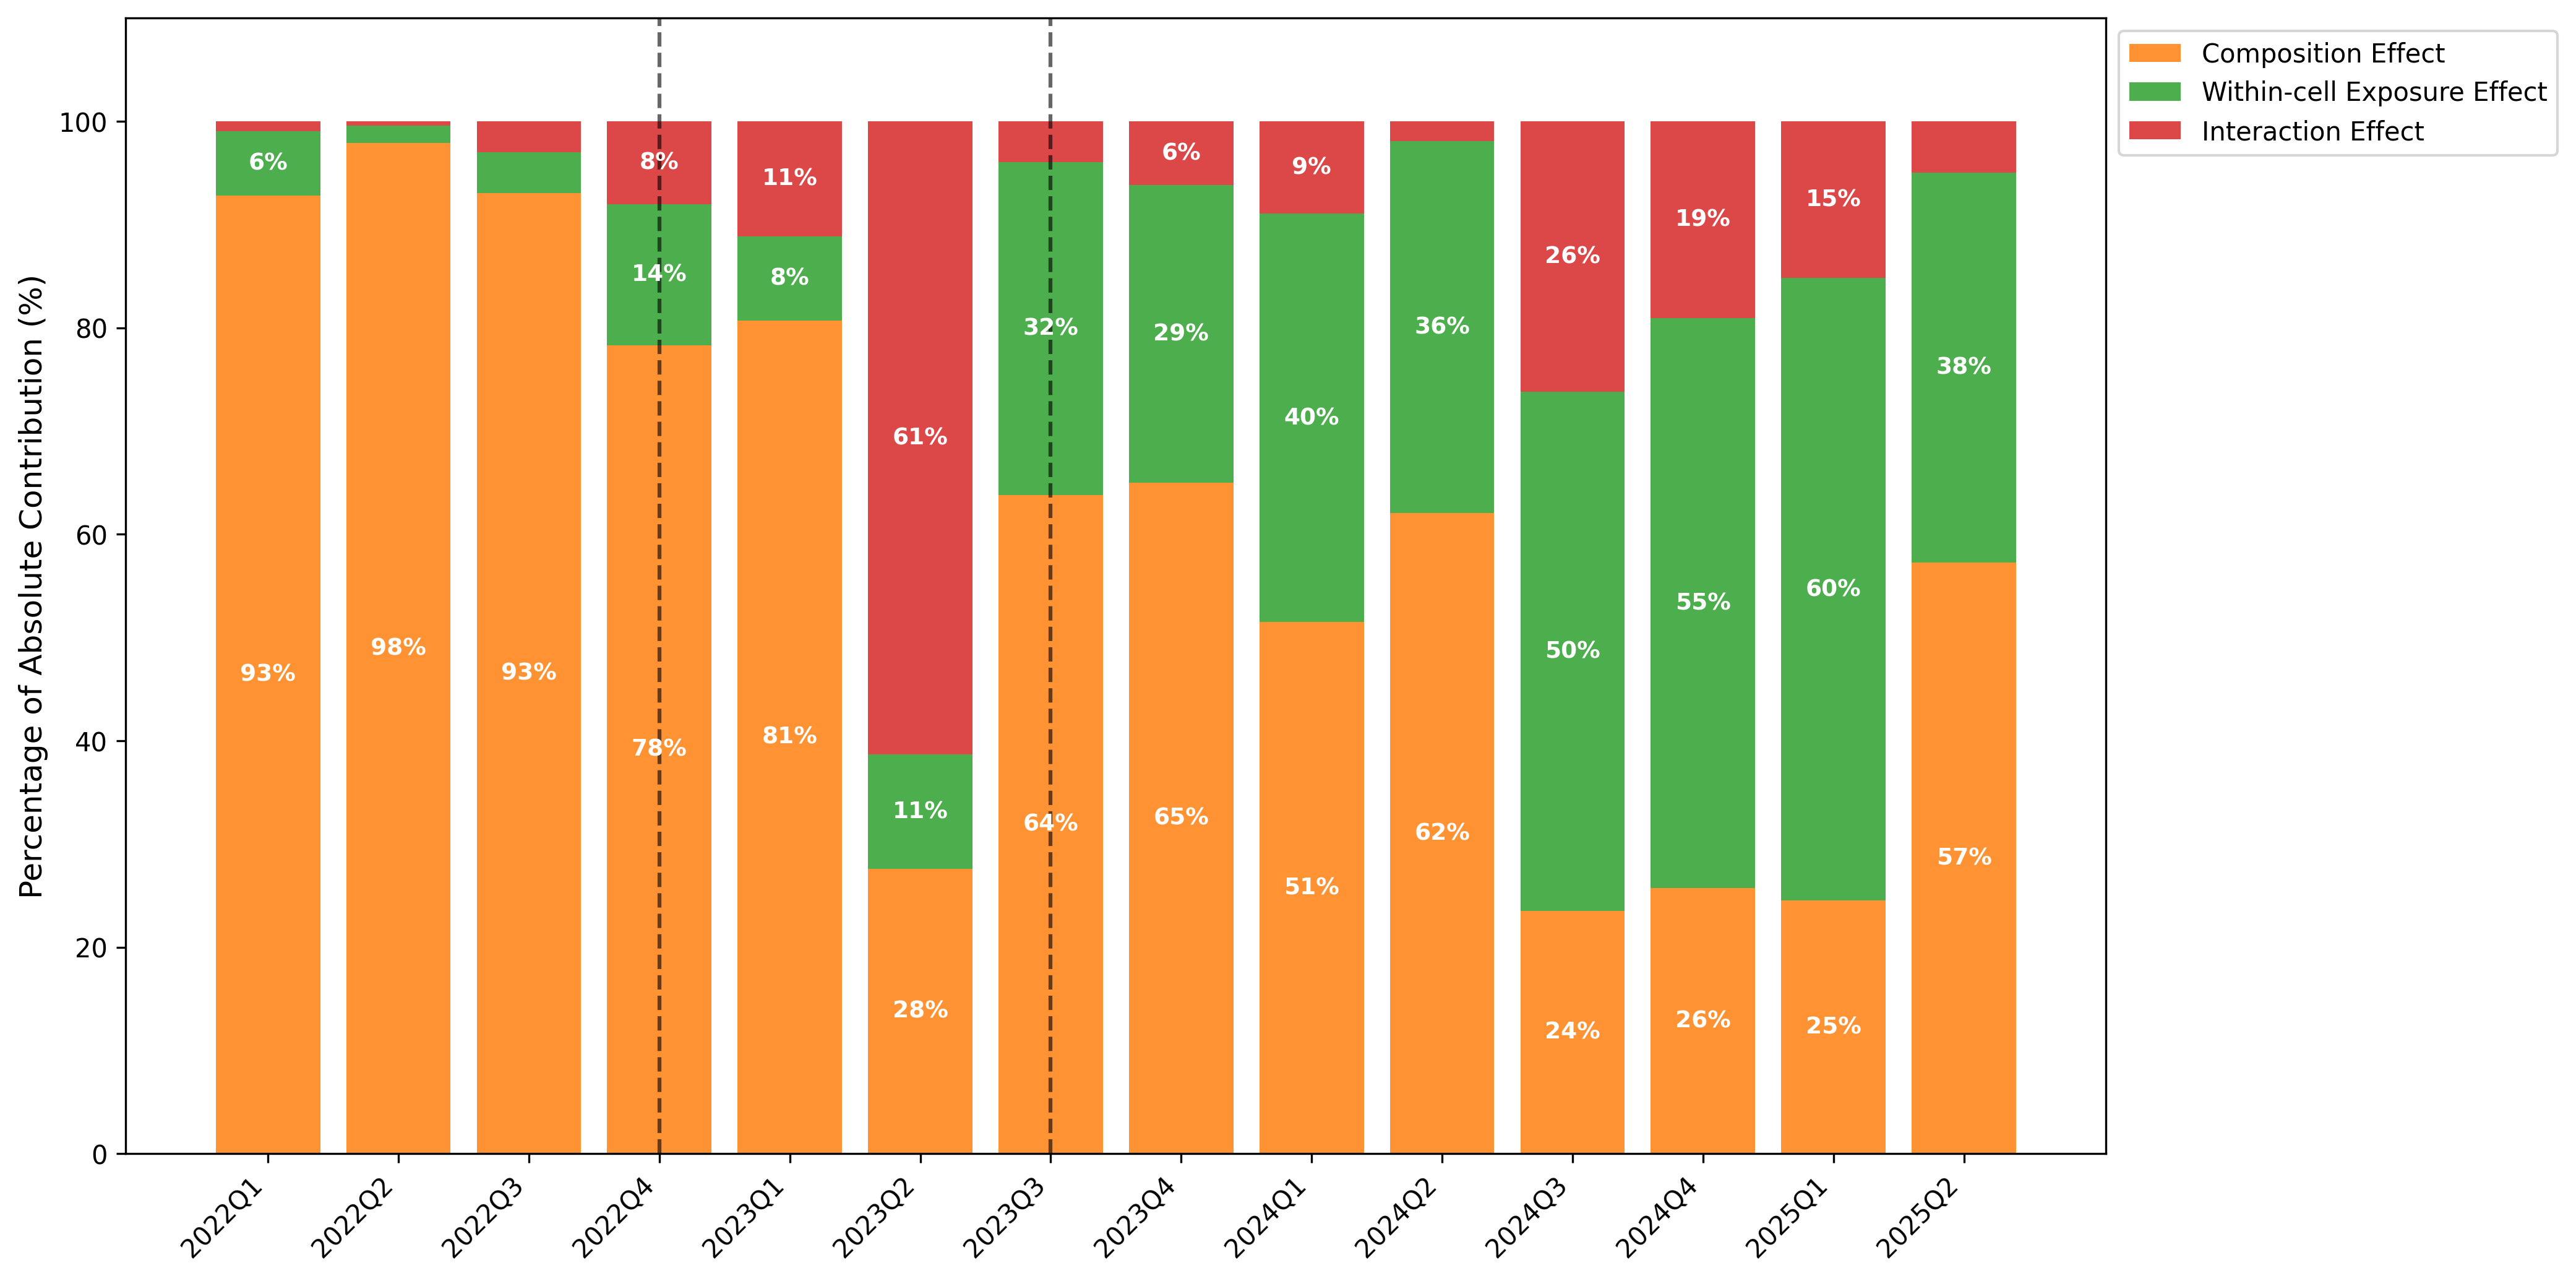
Notes: For each quarter, the figure reports the percentage contribution of each decomposition component in absolute value. The contribution of a component is defined as its absolute value divided by the sum of the absolute values of the composition effect, the within-cell exposure effect, and the interaction effect in that quarter. Quarters begin in 2022Q1 because the decomposition is defined relative to the full-year 2021 baseline.
Figure H10: Relative Contribution of Decomposition Components
H.3 Unpacking the interaction term
The three-fold decomposition isolates an interaction term that captures the joint movement of hiring shares and within-cell exposure. For cell $c$, the interaction contribution is given by
$$ \text{Interaction}_{c}=\Delta w_{c}\times\Delta\beta_{c}, $$
where $\Delta w_{c}$ denotes the change in the posting share of cell $c$ relative to the baseline, and $\Delta\beta_{c}$ denotes the change in exposure within that cell.
This interaction term can arise from four sign combinations. First, when $\Delta w_{c}<0$ and $\Delta\beta_{c}>0$, hiring falls in cells whose exposure is rising; this generates a negative interaction contribution. Second, when $\Delta w_{c}>0$ and $\Delta\beta_{c}<0$, hiring rises in cells whose exposure is falling; this also generates a negative interaction contribution. Third, when $\Delta w_{c}>0$ and $\Delta\beta_{c}>0$, hiring rises in cells whose exposure is also rising; this generates a positive interaction contribution. Fourth, when $\Delta w_{c}<0$ and $\Delta\beta_{c}<0$, hiring falls in cells whose exposure is also falling; this likewise generates a positive interaction contribution.
Figure H11 summarizes the average quarterly contribution of these four cases. The figure shows that the interaction term reflects offsetting patterns across cells rather than the absence of interaction altogether.
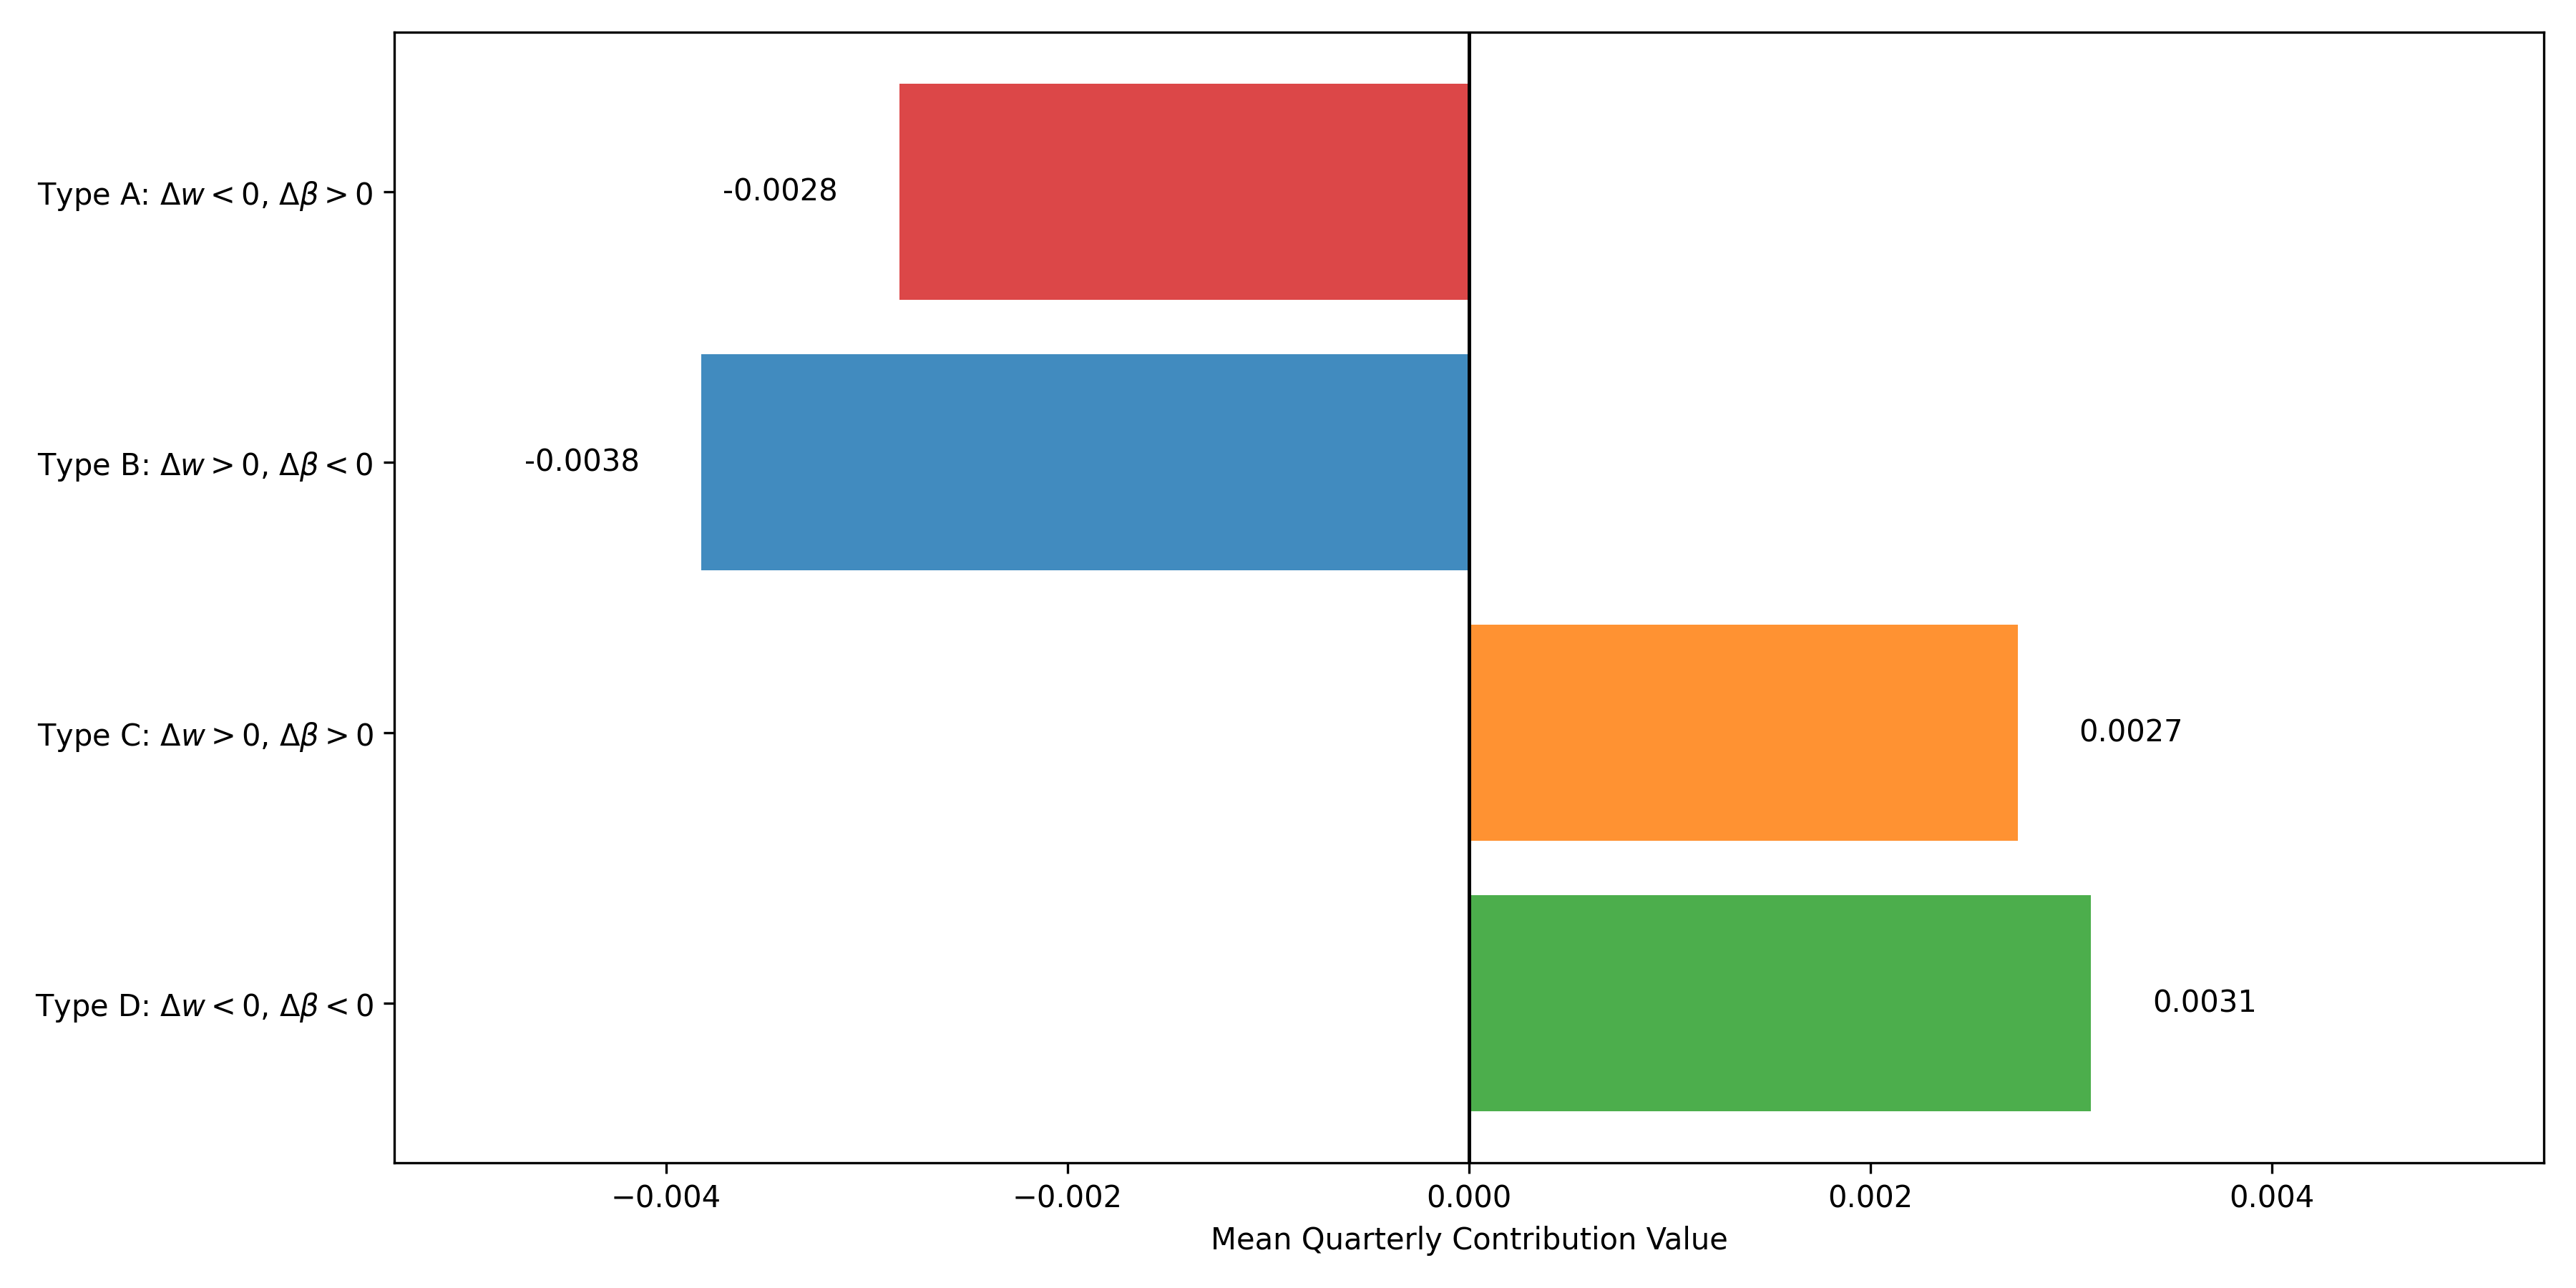
Figure H11: Average Quarterly Contribution to The Interaction Term by Sign Pattern
H.4 Sign structure of the interaction term for junior postings
Figure H12 decomposes the interaction term for junior postings by the sign of changes in hiring shares and within-cell exposure.
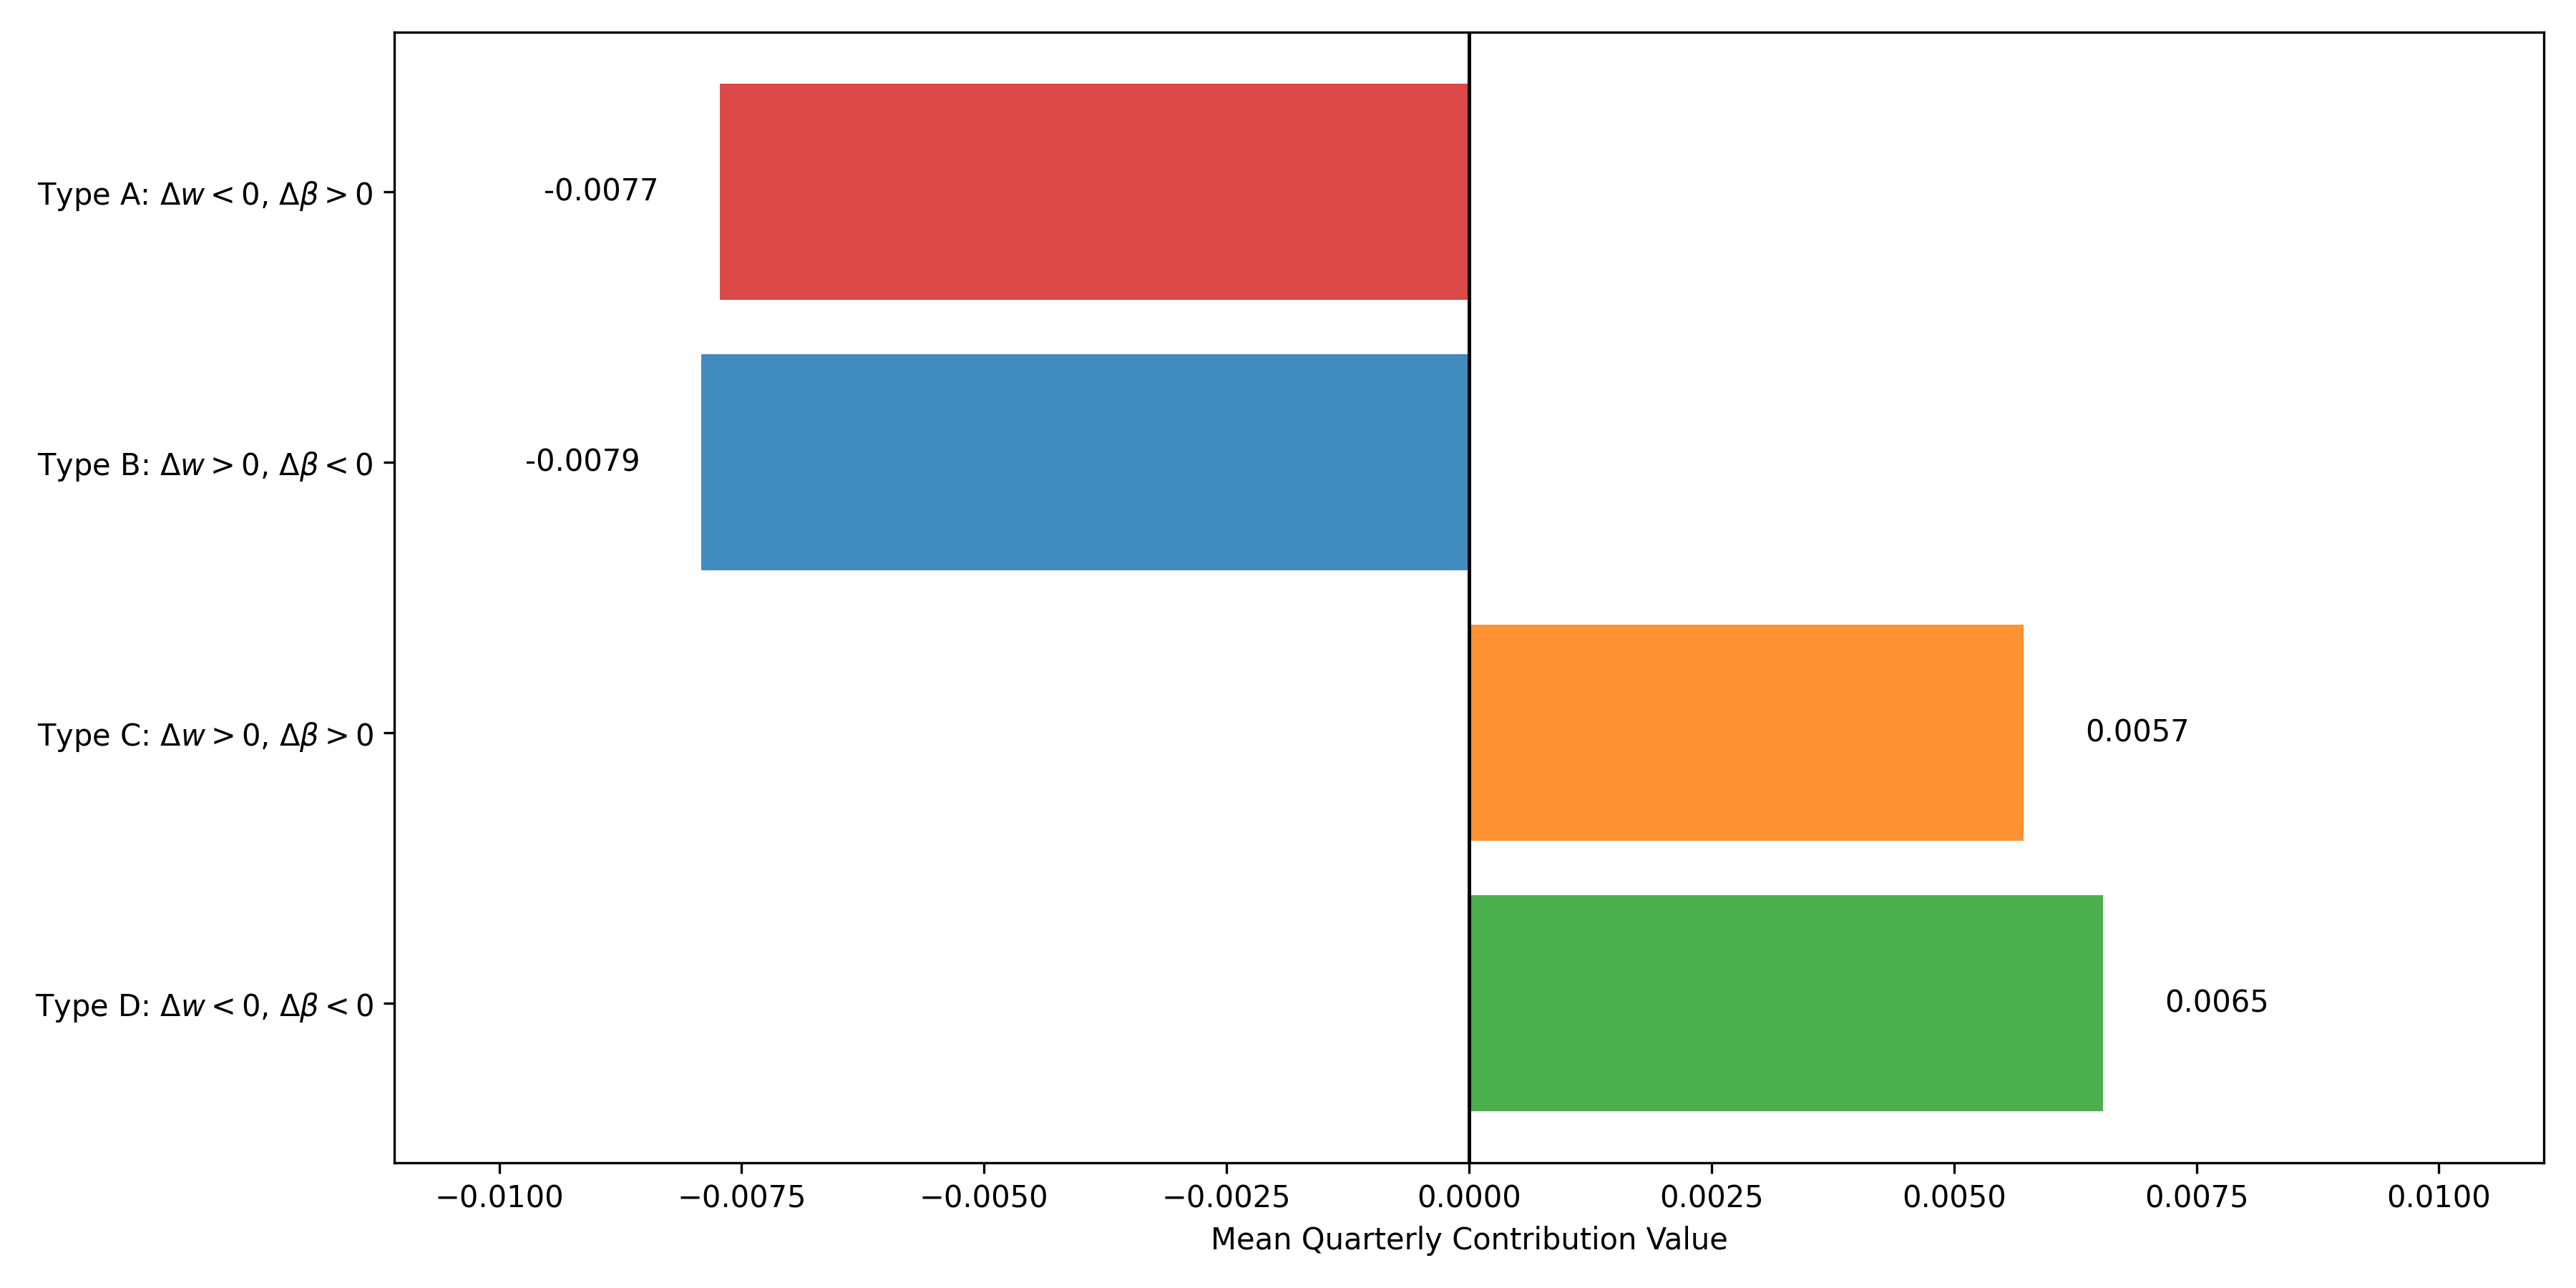
Figure H12: Average Quarterly Contribution to The Interaction Term by Sign Pattern: Junior Postings